Sales Dashboard
BUMN
UI/UX
Web
Optimizing Sales Dashboard: Enhancing Key Metrics for Account Managers to Make Informed Trading Decisions
Year
2024
Services
Website Design, Dashboard, UI Design
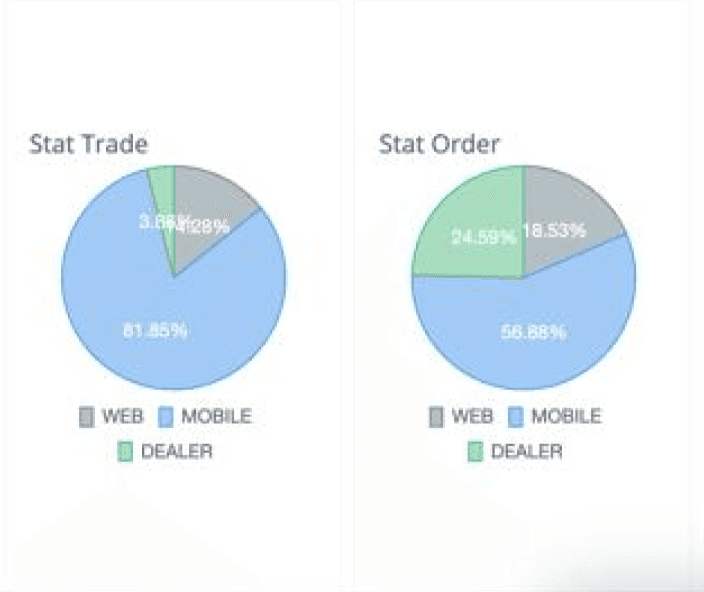
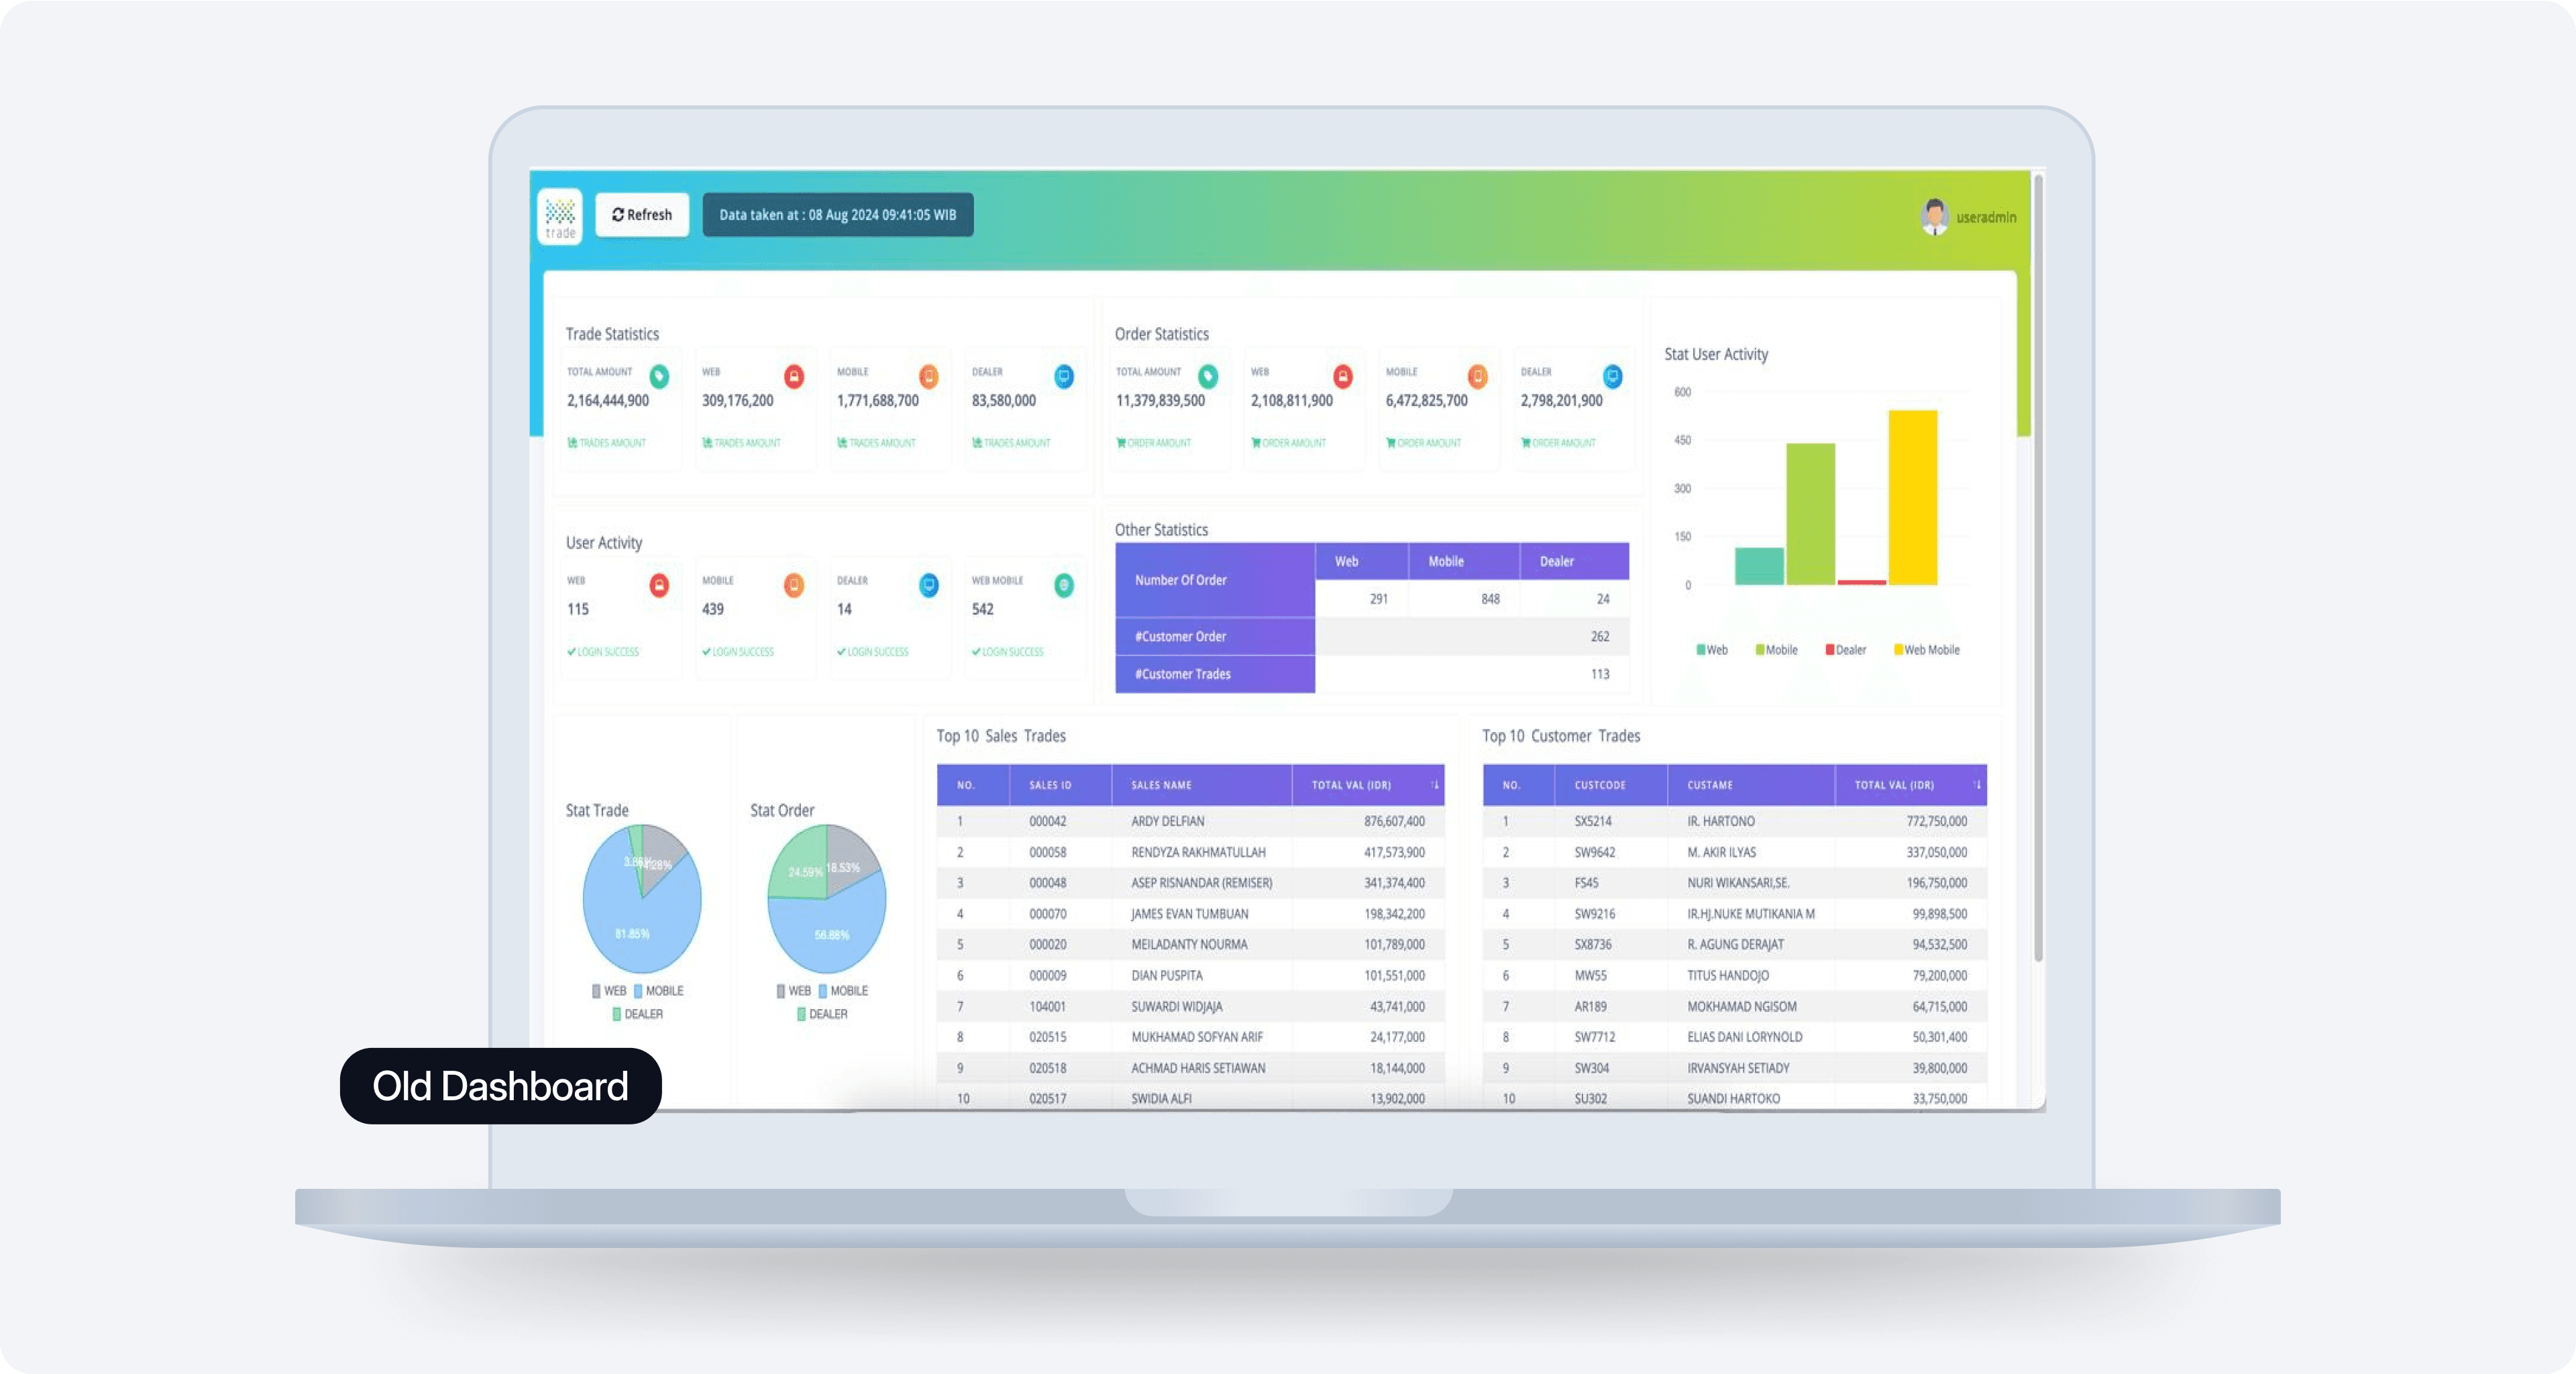
Dashboard Assessment
The current dashboard design lacks clarity and is cluttered, occupying excessive space without delivering key insights efficiently.
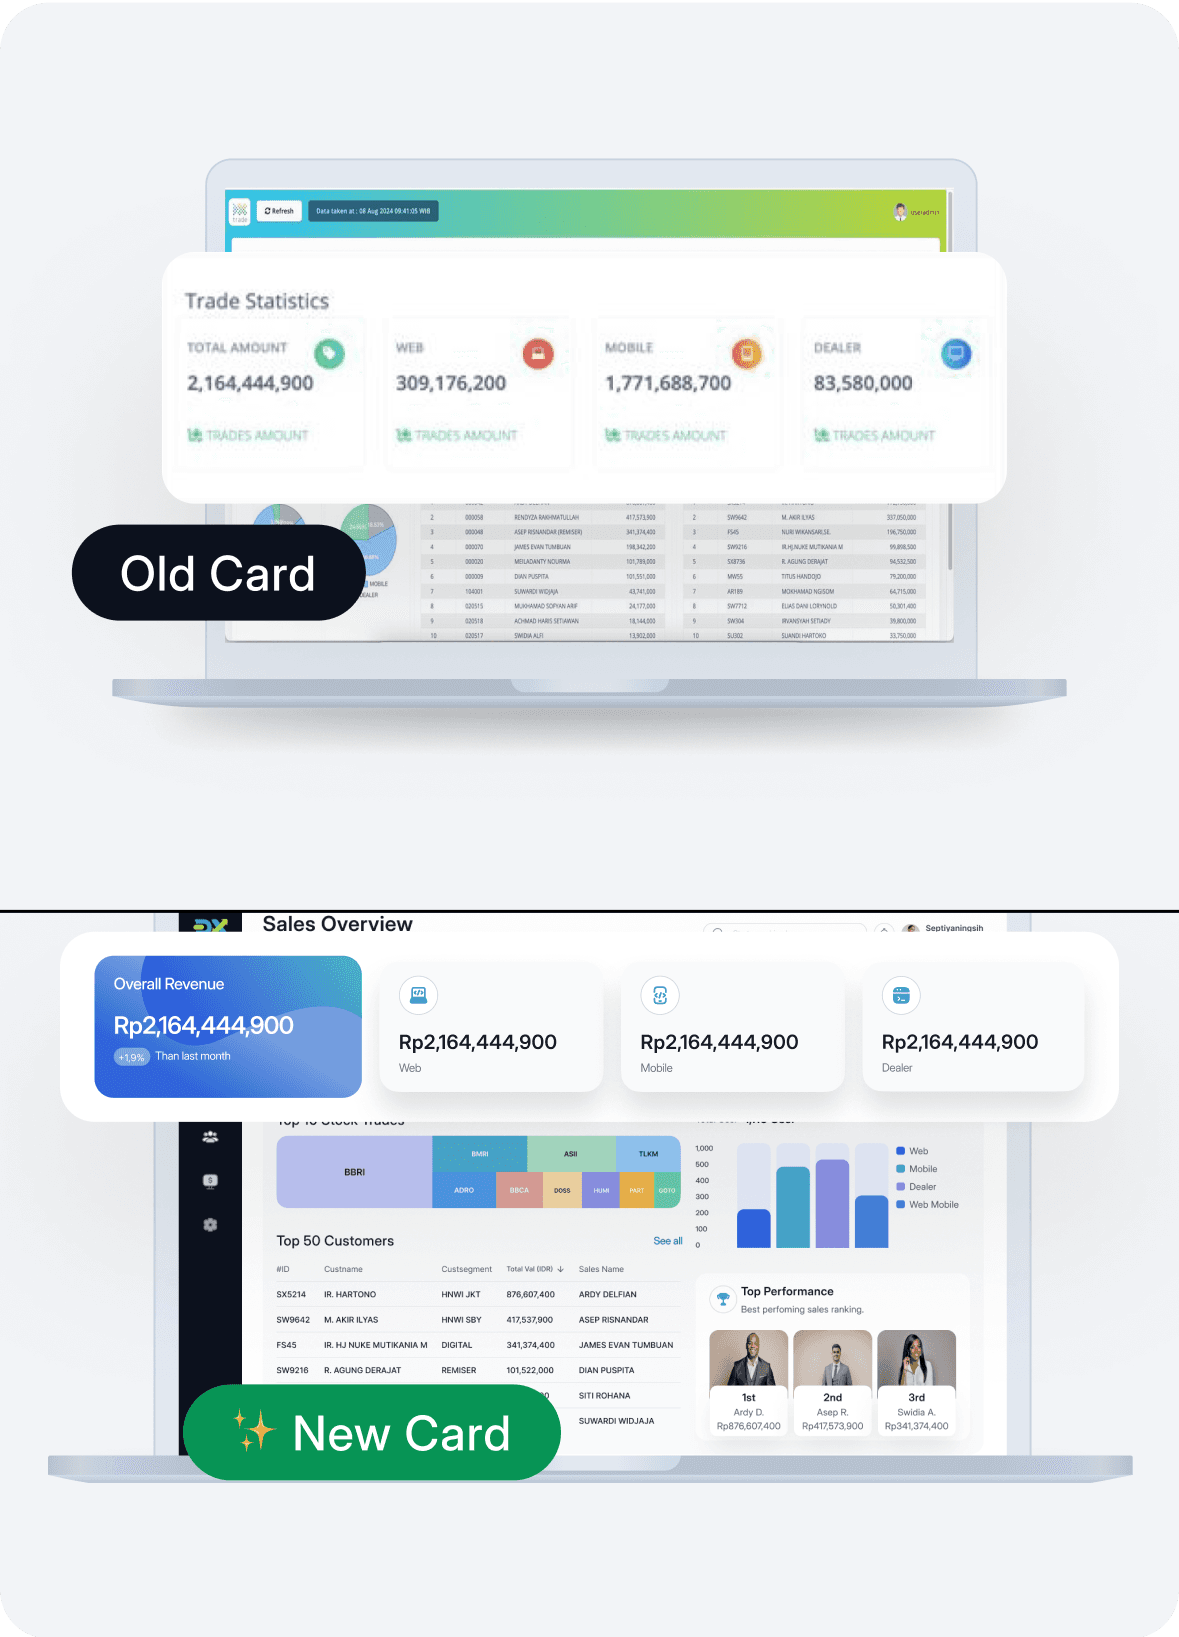
Old Card Information
Overall Revenue
+1,9%
Than last month
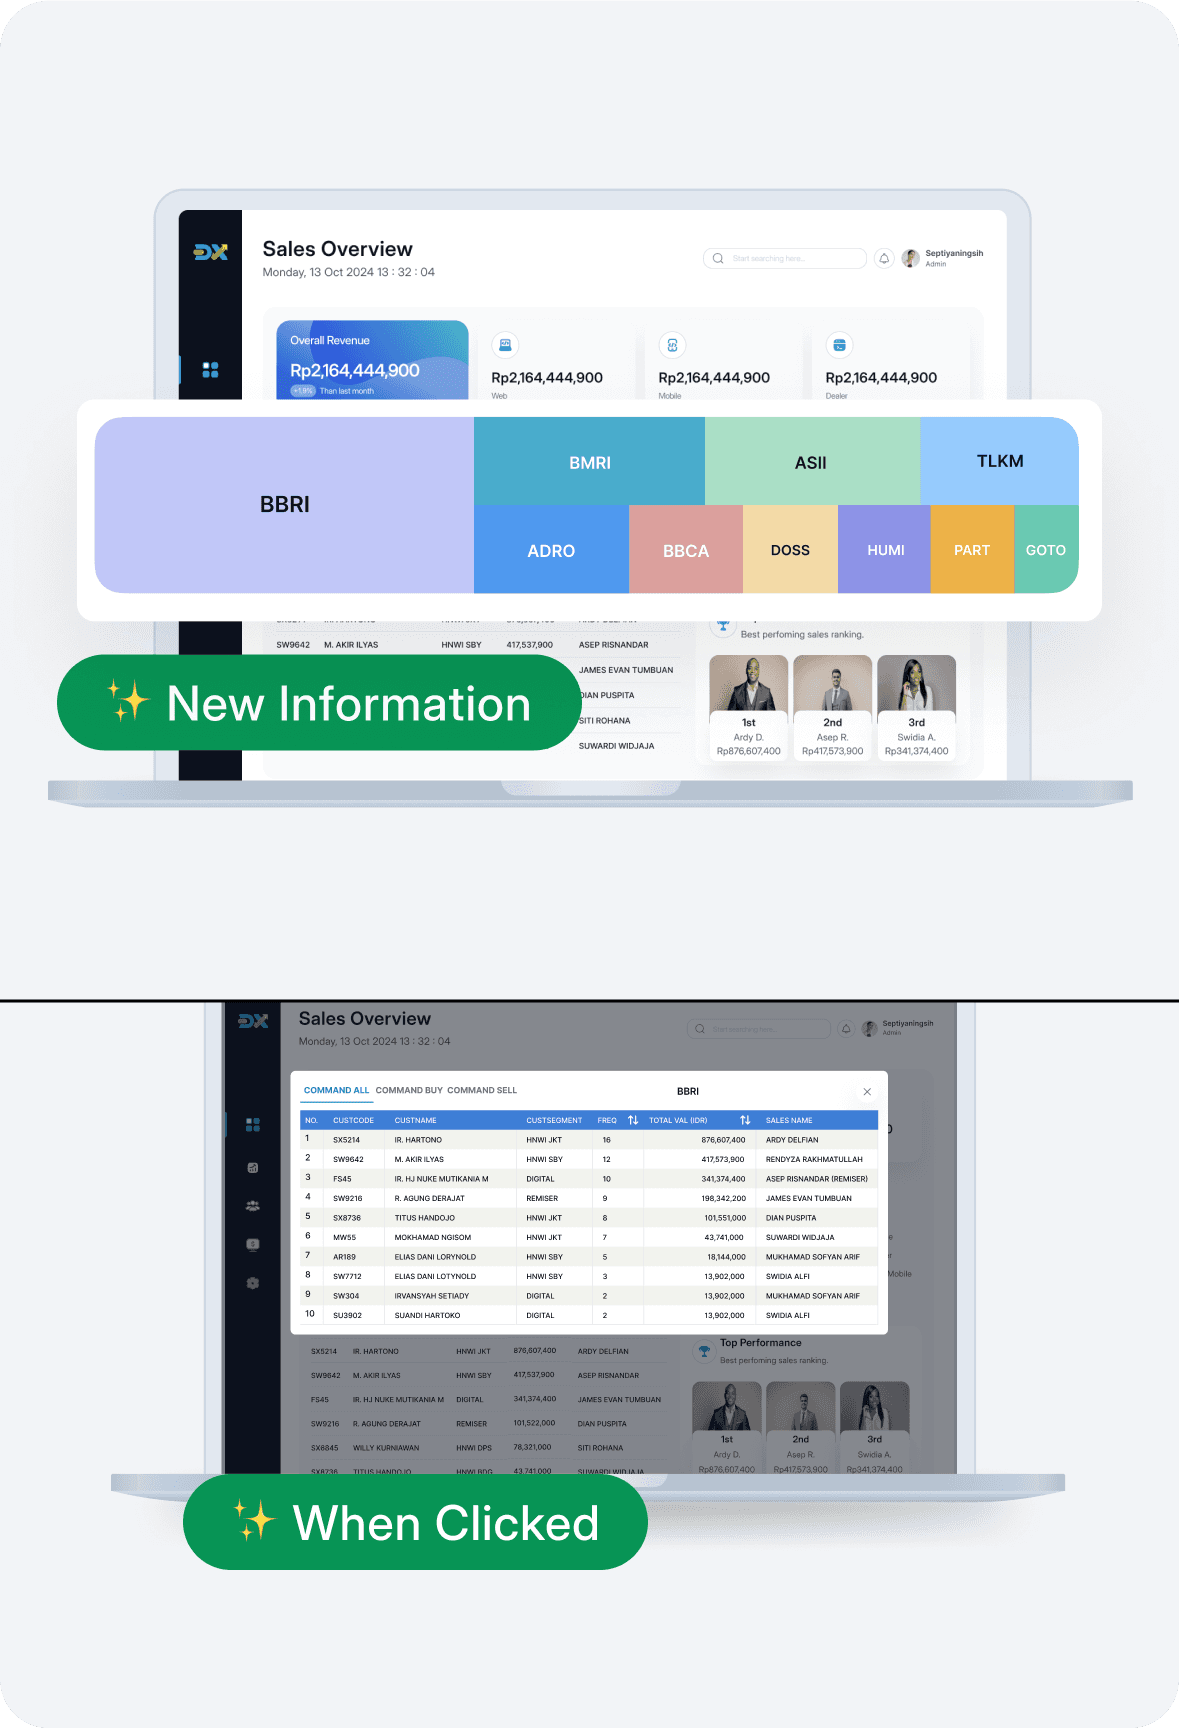
New Card Information
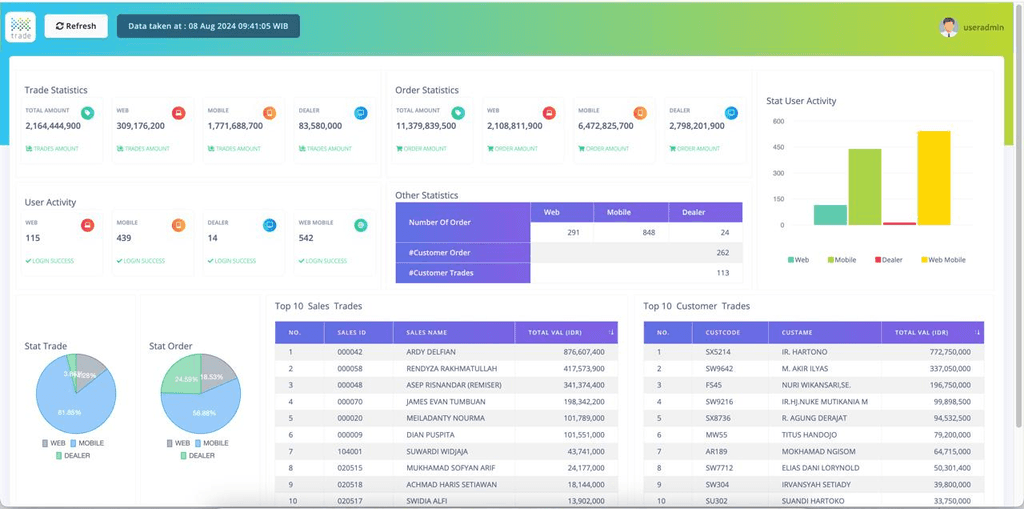
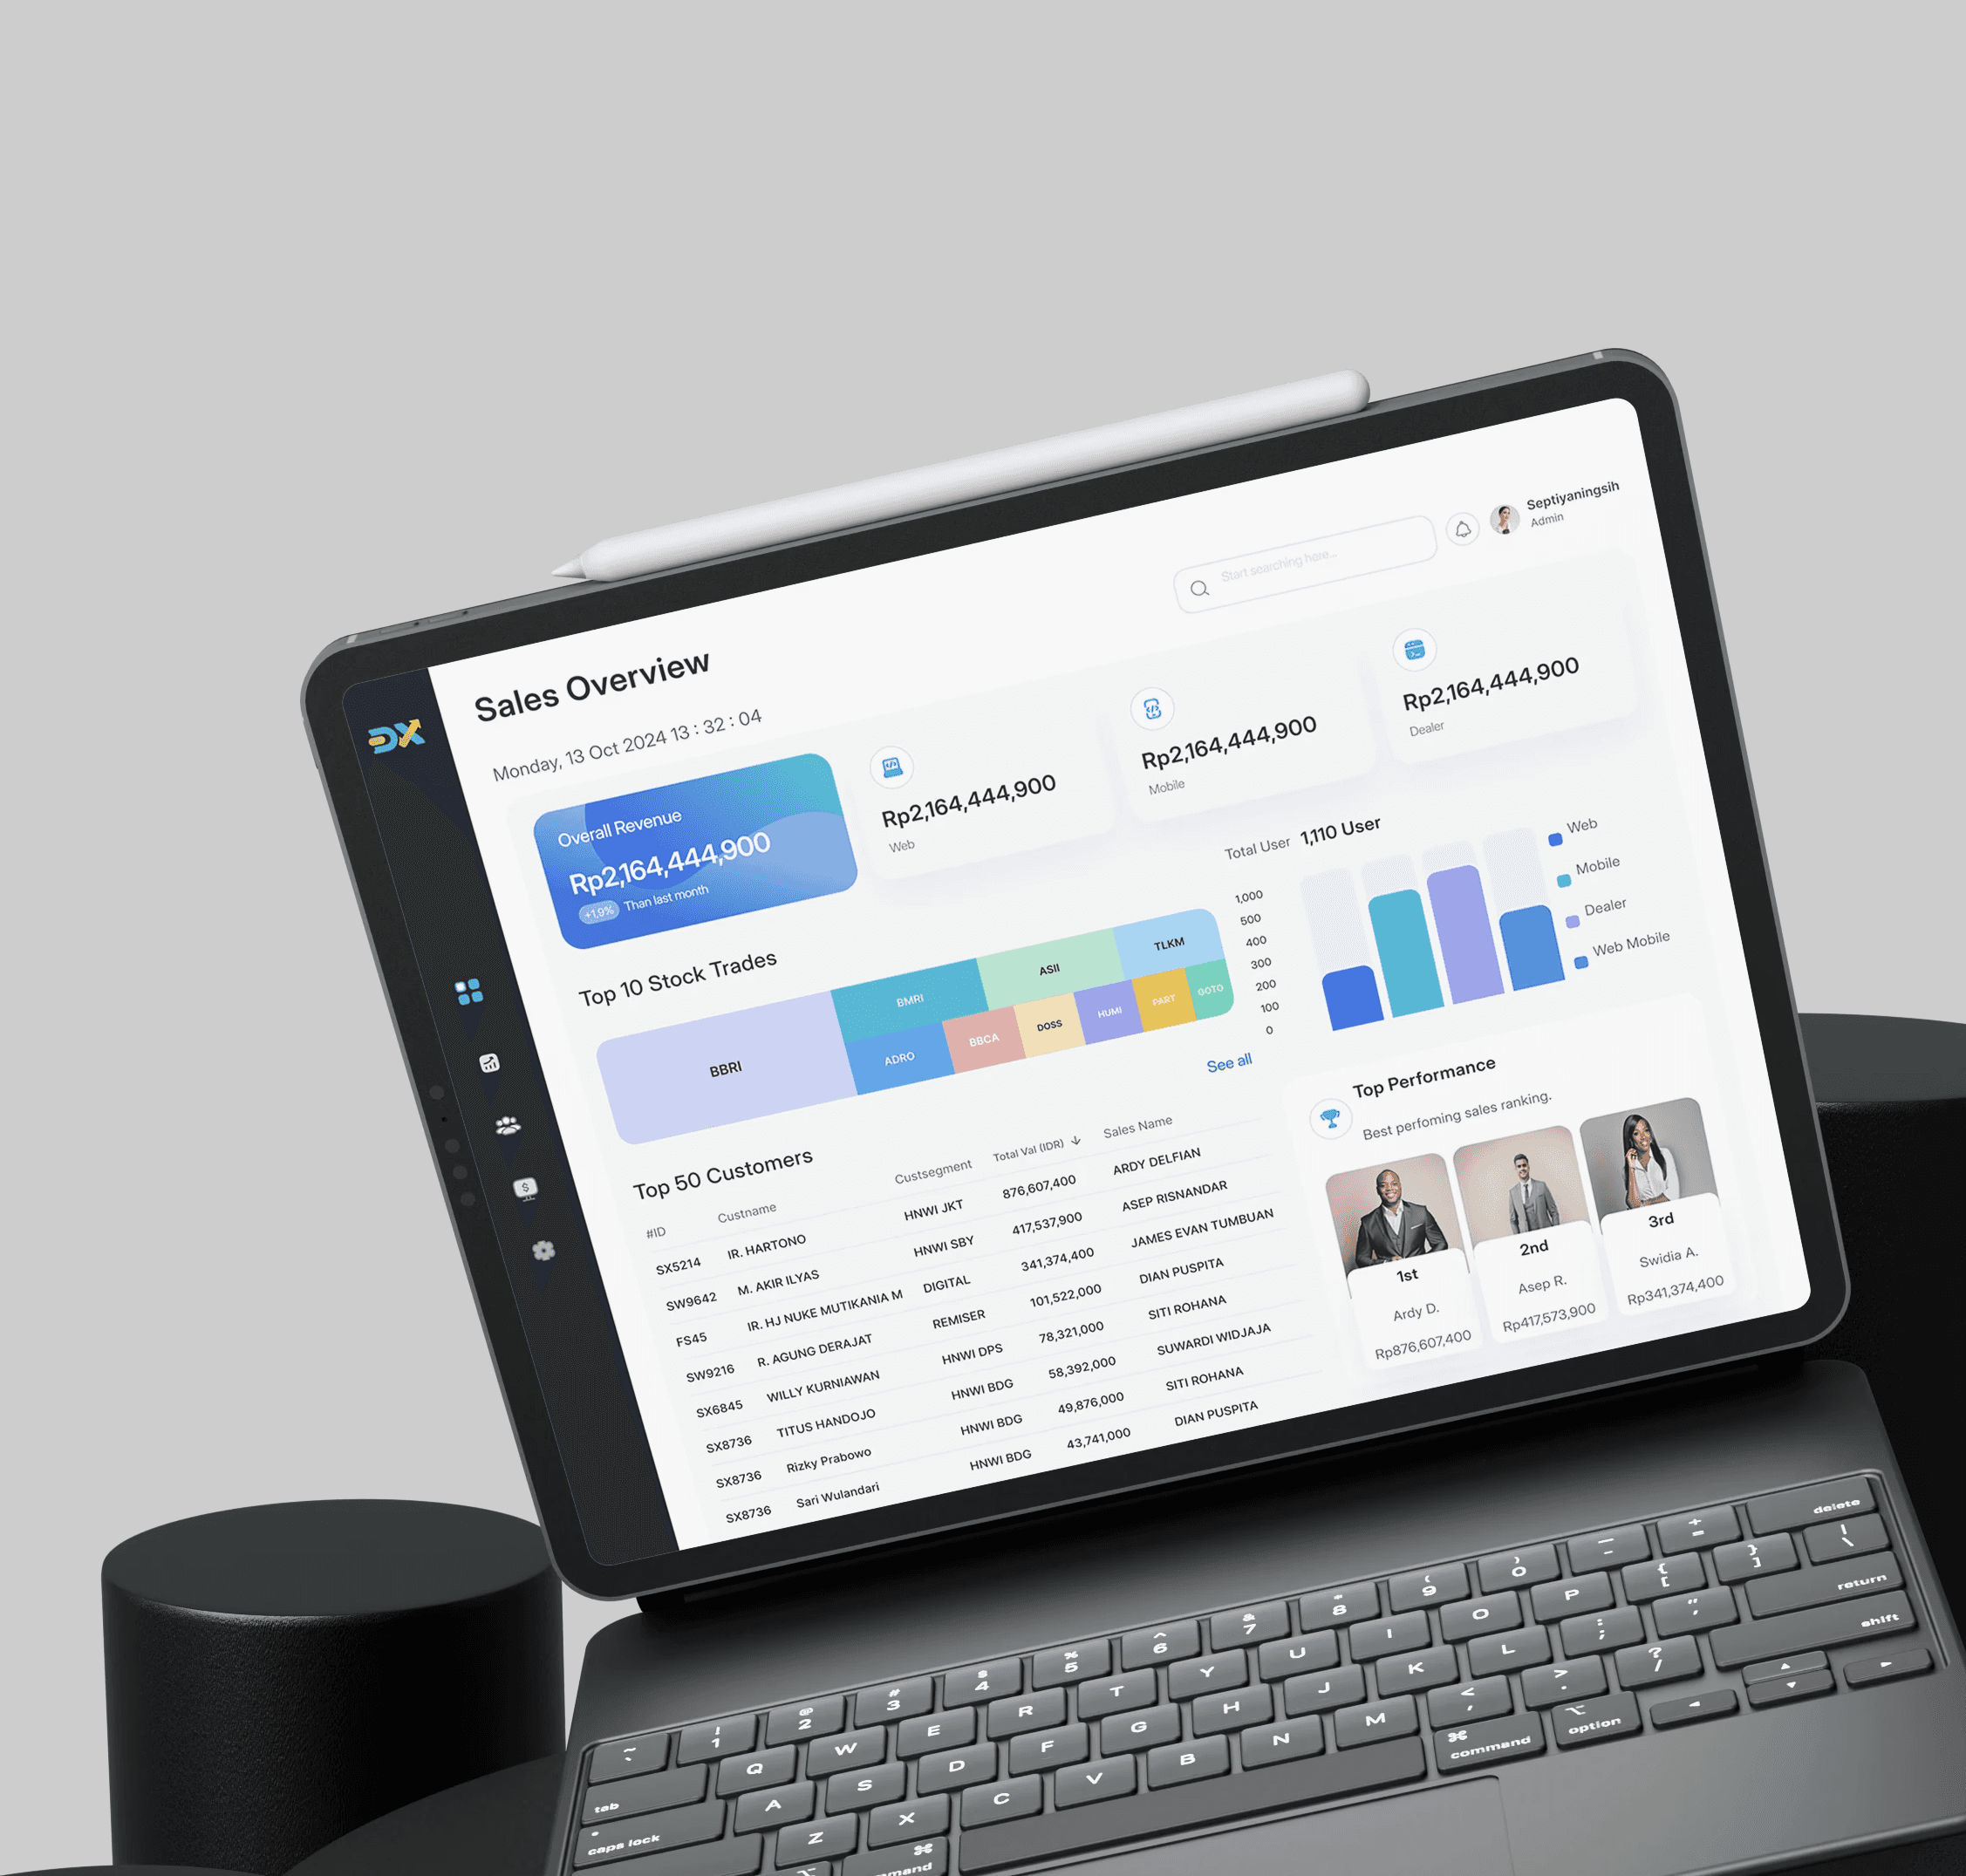
Dashboard and Priorities
This dashboard presents a variety of key information designed to support the decision-making process for an Investment Specialist (IS). Some of the critical data available includes:
Total trade value statistics
Order amount
User activity, both via Web and Mobile
And much more
Each piece of information is prioritized differently depending on the context and needs of the IS. Among this data is also a Top 10 Customer Trades table, which provides insights into customers with limited purchasing power, helping the IS to determine the right strategies.
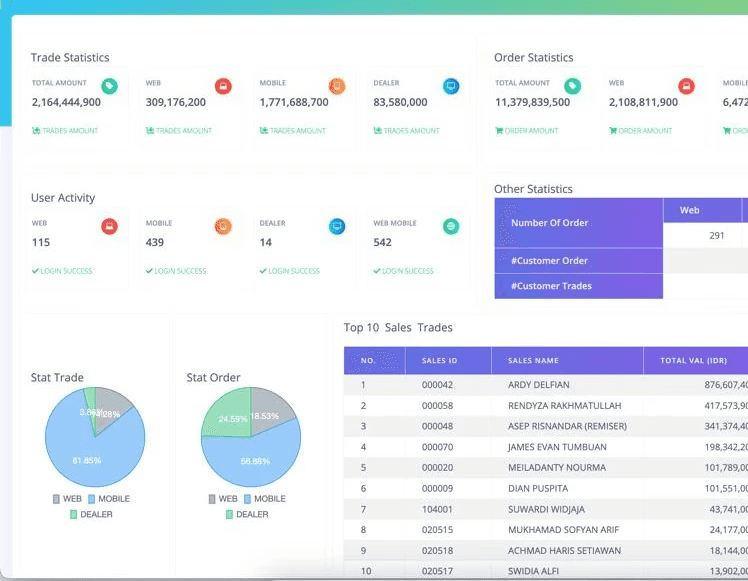
Closer Look
When we take a closer look at the card, the composition of the information includes:
A title to capture attention
An icon for each piece of information
Amount or trade value
It’s simple and straightforward, but still not informative enough for an Investment Specialist (IS).
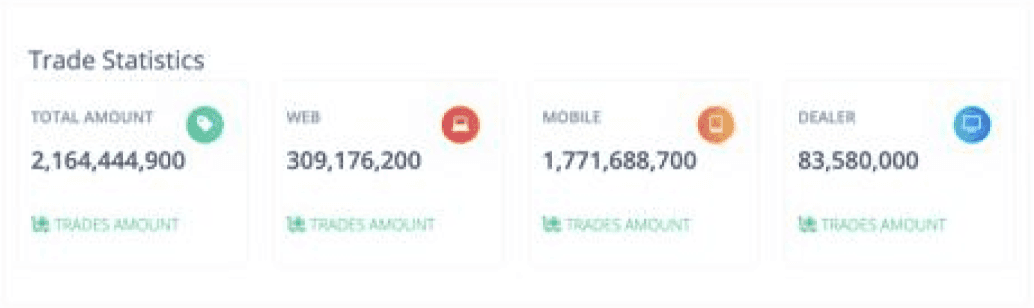
Problem 01
Redundancy Overload
The current dashboard layout suffers from duplicated information, leading to inefficient use of space. This cluttered design not only makes navigation cumbersome but also diminishes the overall effectiveness of the dashboard.
Problem 02
One major issue with the dashboard is the lack of real-time data on daily stock trades, making it difficult for account managers to stay updated on critical market activities. Without up-to-the-minute information, Investment Specialist (IS) are unable to make timely, informed decisions regarding which stocks to buy or sell.
Goals and Objectives
To better align our vision, we define the goals and objectives of our current initiatives, covering:
The goals are clear, and the possibilities are endless. Now is the time to address those challenges head-on
The User
Head Investment Specialist (IS) of Bahana Sekuritas
For those unfamiliar with the Capital Market industry, you might wonder, “What exactly is needed in this dashboard?” Allow me to explain the key requirements:
Streamlining duplicate information
Adding real-time data on stocks being traded today
Including the IS's name in the Top 10 Customer Trades

Inspiration Landscape
Inspiring Dashboard Designs for Enhanced Data Visibility
Explore diverse, modern dashboard layouts that prioritize functionality and clarity. These design inspirations focus on presenting essential metrics through intuitive interfaces, helping account manager access critical information quickly and efficiently.
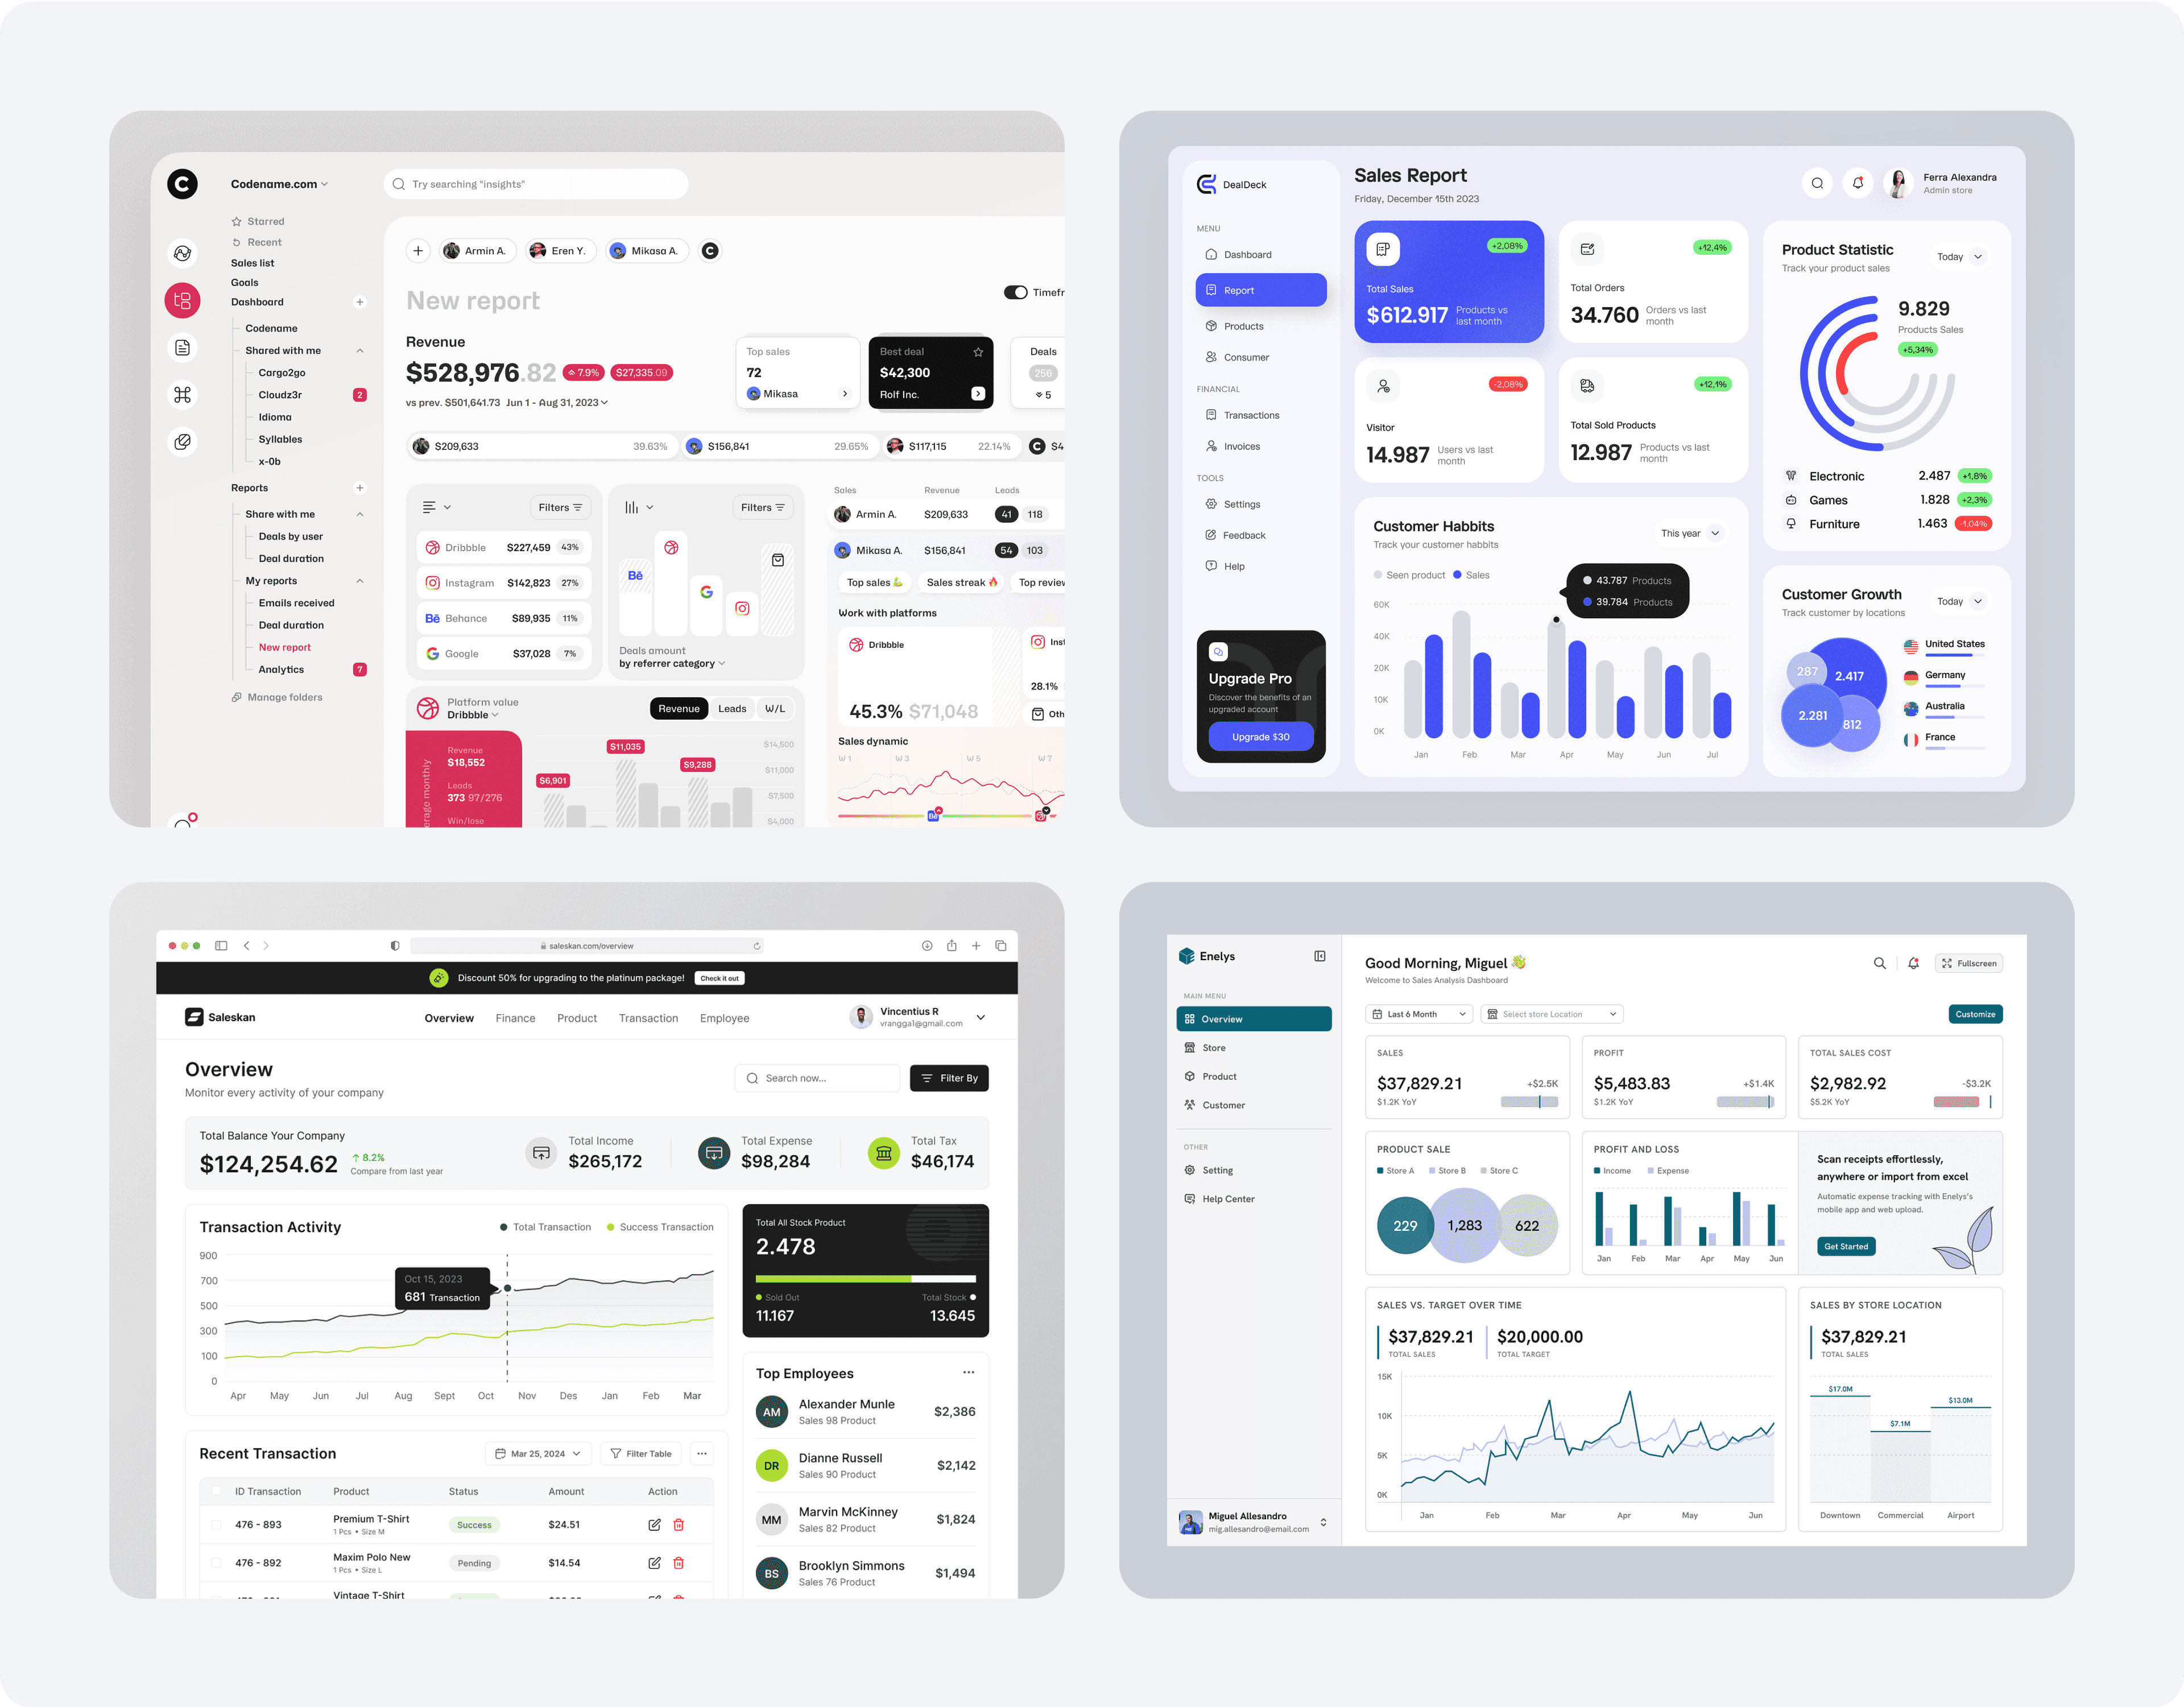
Bottom Line
The key to an effective sales dashboard lies in balancing comprehensive data presentation with user-friendly design. By taking inspiration from these modern layouts, I’m can enhance its dashboard’s functionality, making critical trading for Investment Specialist. This will lead to faster, data-driven decision-making, ultimately supporting better trading outcomes and improved performance.
The Solutions
High-Level Concept for Redesigning the Dashboard
01
Enhancing Dashboard Efficiency
Address the challenge of information redundancy by redesigning the dashboard to eliminate duplicate data and streamline the layout. By consolidating similar metrics and presenting them in a more organized manner, I’m create a more intuitive and efficient user experience.
02
Real-Time Stock Trading Insights
By integrating up-to-the-minute information on daily stock trades, the dashboard will empower IS with the critical insights they need to stay ahead in fast-moving markets, ensuring they can react swiftly and strategically to buy or sell stocks at the right moment.
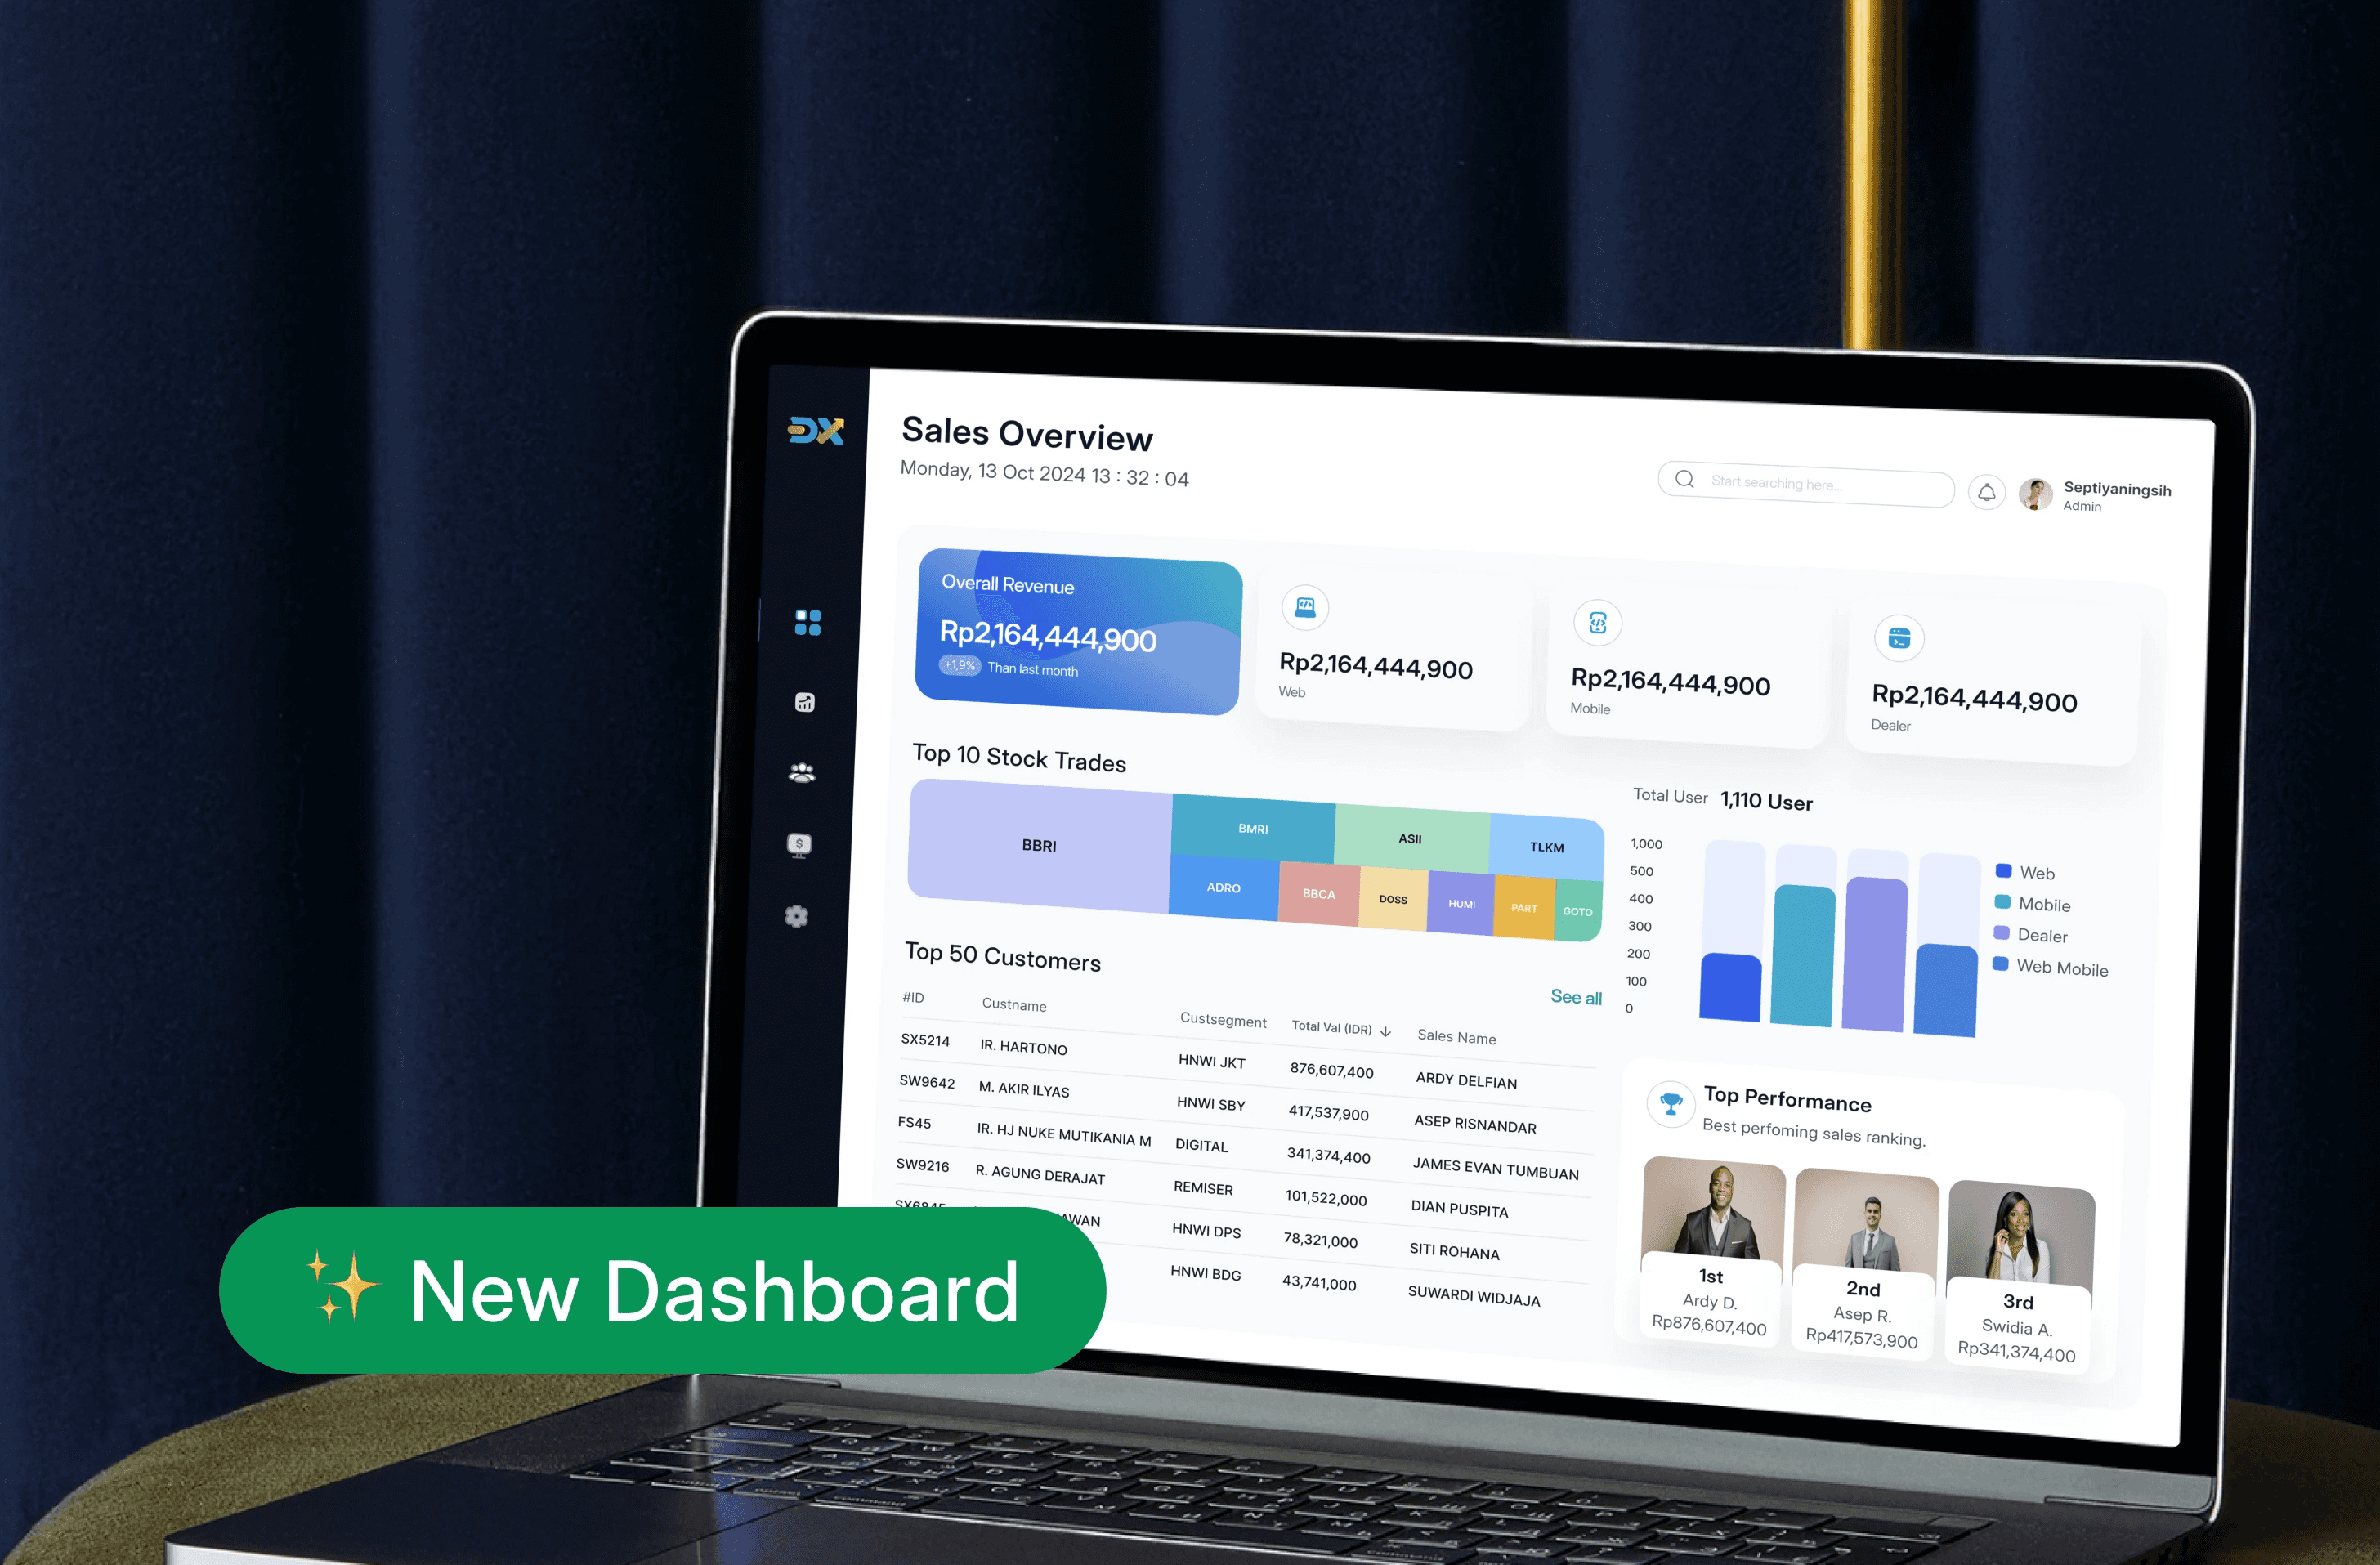
The New Dashboard
Relationale Behind the New Dashboard
Explore diverse, modern dashboard layouts that prioritize functionality and clarity. These design inspirations focus on presenting essential metrics through intuitive interfaces, helping account manager access critical information quickly and efficiently.
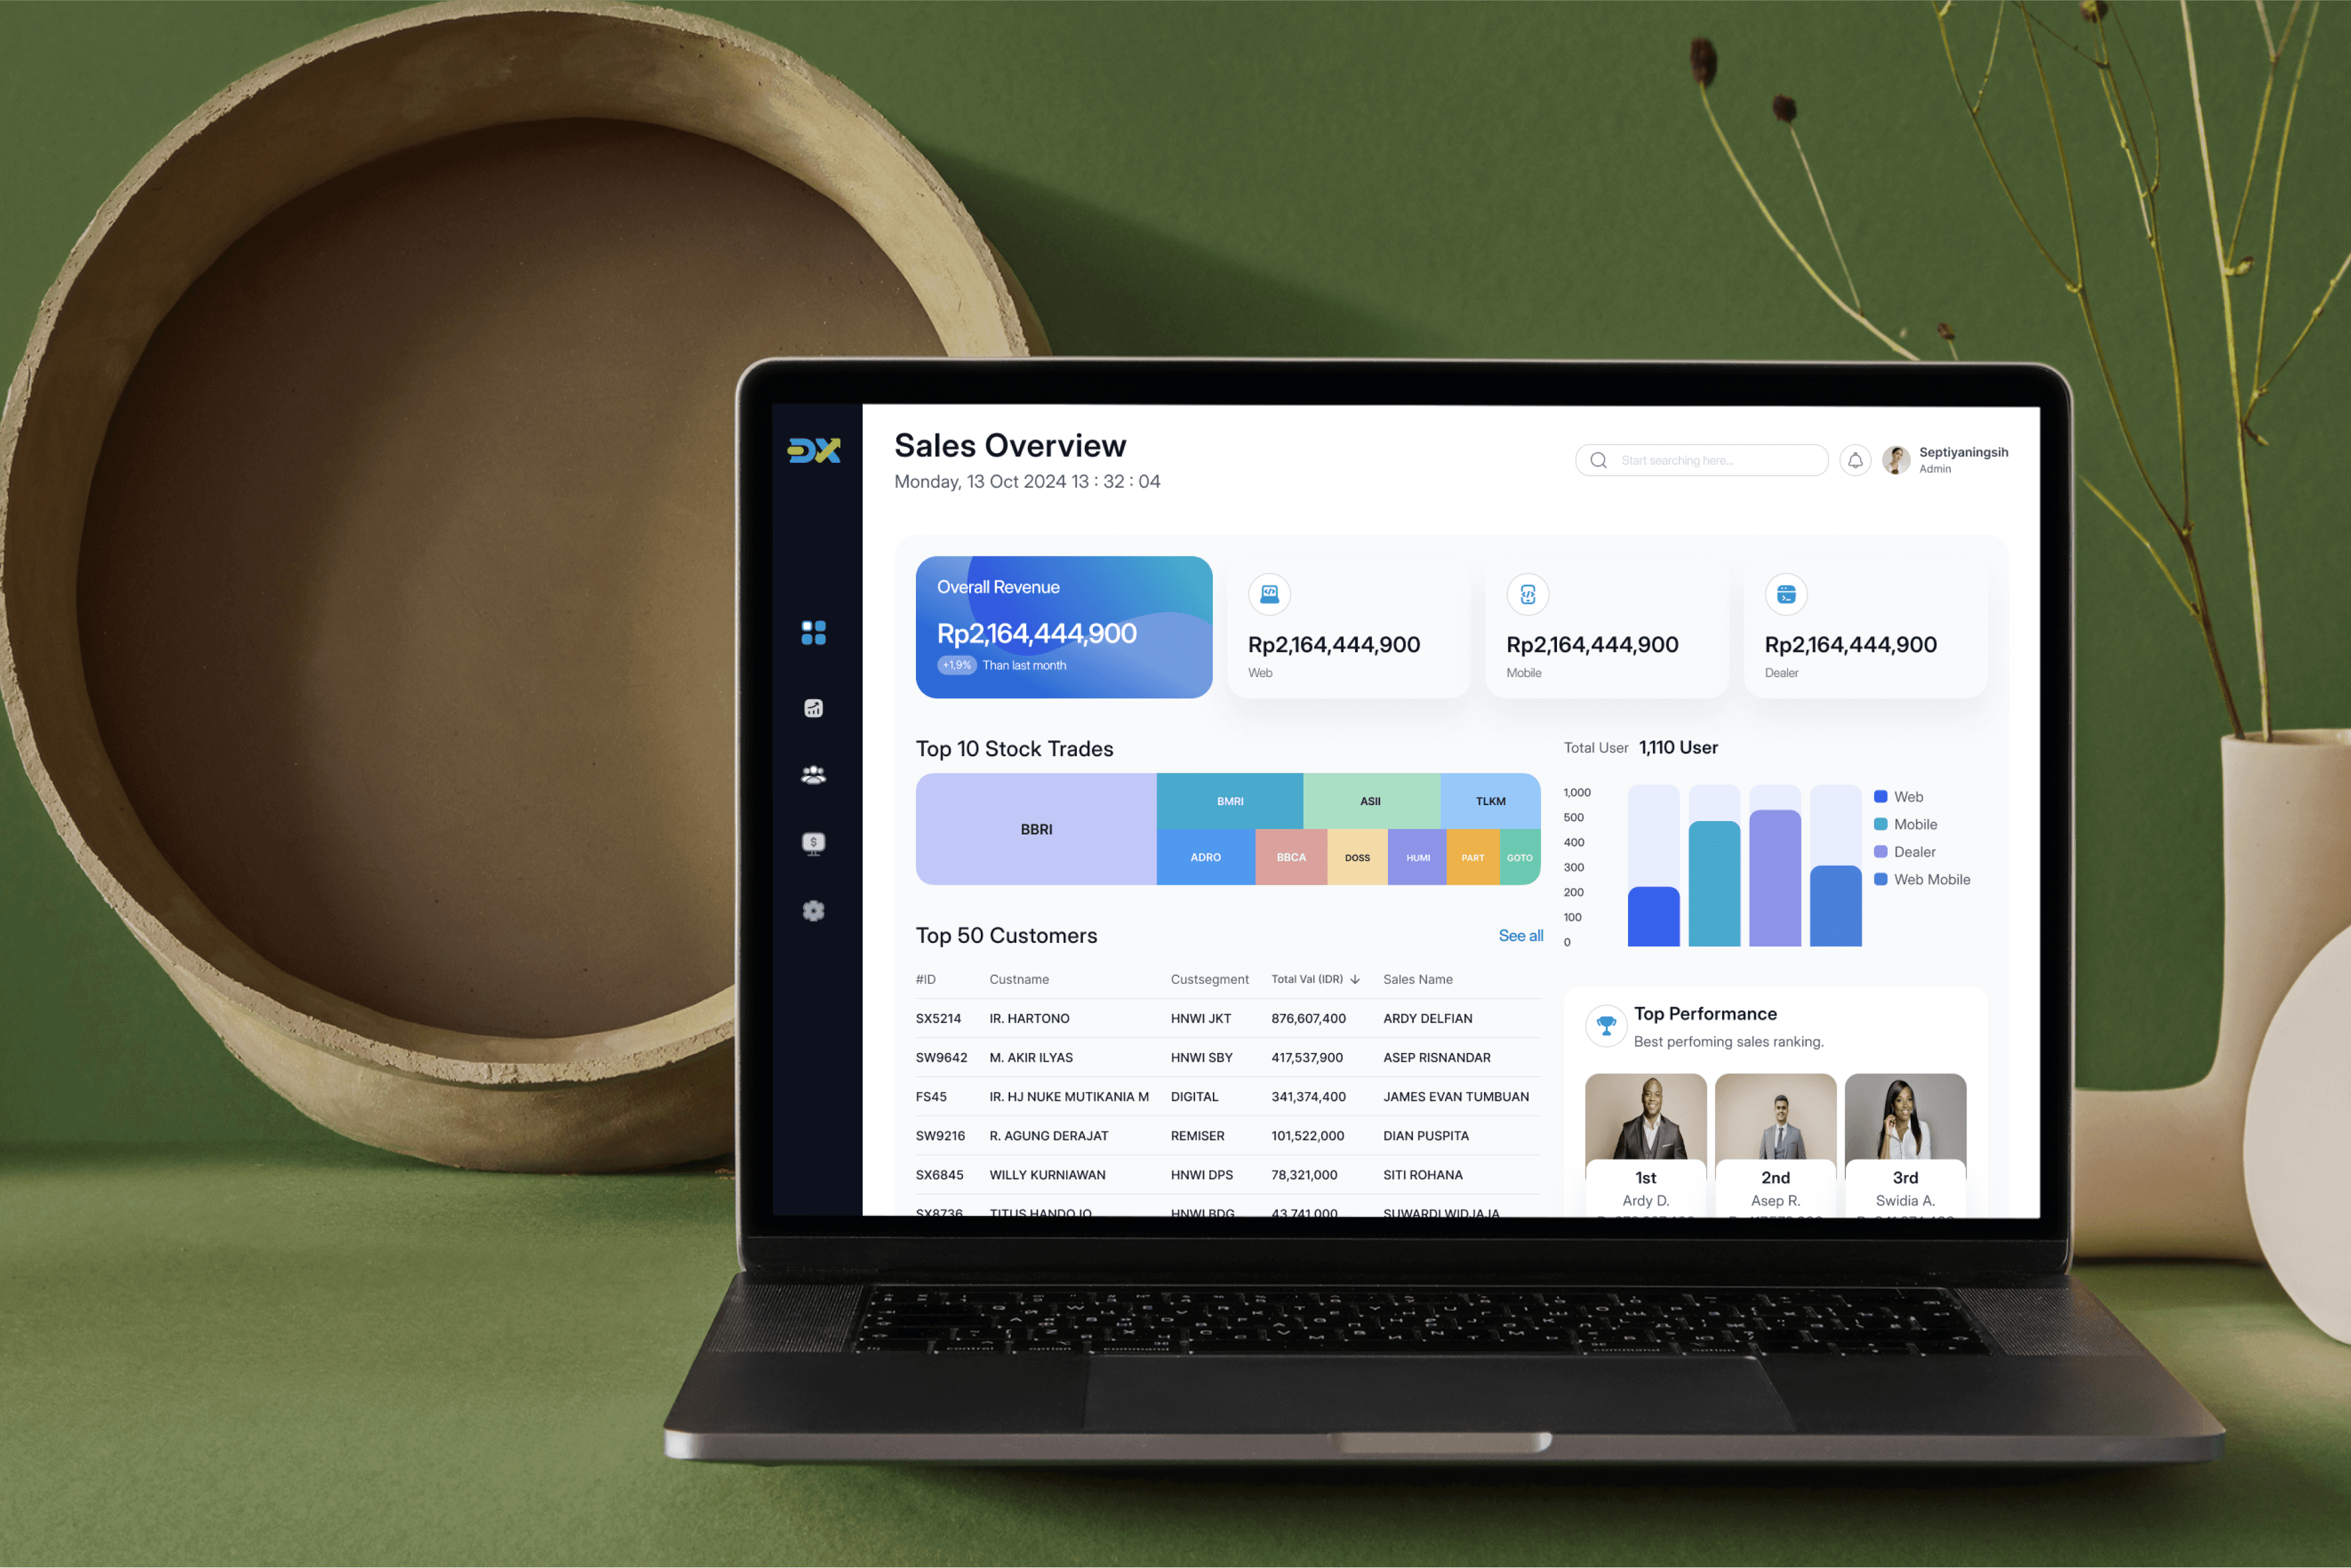
The Redesign
The redesign of Bahana Sekuritas’ sales dashboard was driven by the need to solve key issues Investment Specialist (IS) faced in their daily work.
The new dashboard brings several important improvements: Elimination of Redundant DataReal-Time Stock DataImproved User ExperienceIn summary, the redesigned dashboard gives IS the tools they need for more efficient stock trading, better decision-making, and improved overall performance.
Design Validation
Give It a Quick Fix
The new dashboard design has significantly improved the user experience for Investment Specialist (IS). Key metrics demonstrate a noticeable increase in engagement, faster navigation, and easier decision-making due to actionable data.
How has user engagement improved with the new dashboard design?
The new design has led to a 30% improvement in user engagement, allowing IS to quickly comprehend the information displayed.
Iteration
Improving Usability and Enhancing Performance
Streamlined the display of statistics and data visualizations to make the information easier to digest and interpret at a glance, while also adding daily stock trade data for more comprehensive insights.
End Result
After the redesign, Bahana Sekuritas dashboard saw a 30% increase in user engagement and a 20% reduction in navigation time.
Providing valuable insights into how the enhanced features and streamlined layout have positively impacted their day-to-day operations. This combination of data-driven analysis and direct user feedback underscores the effectiveness of the redesign in improving both usability and decision-making efficiency.